Monitoring
Windows Performance Monitor
How to use Windows Performance Monitor
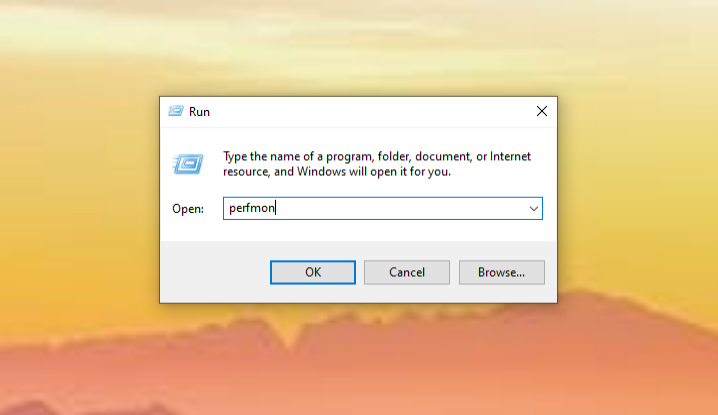
- Open the Run menu (Ctrl+r) and type in “perfmon”, then click “run”.
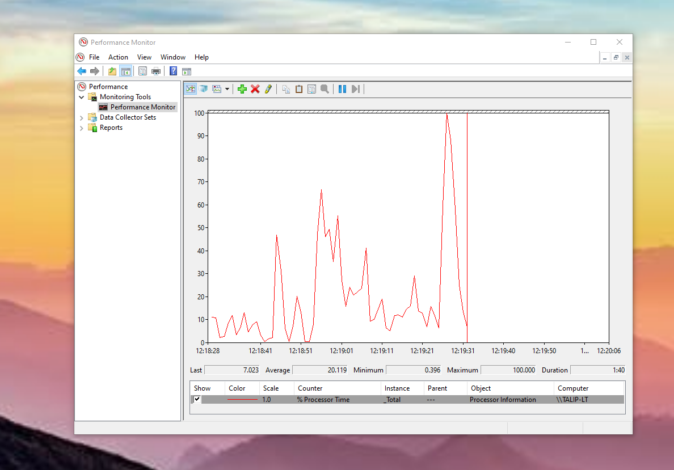
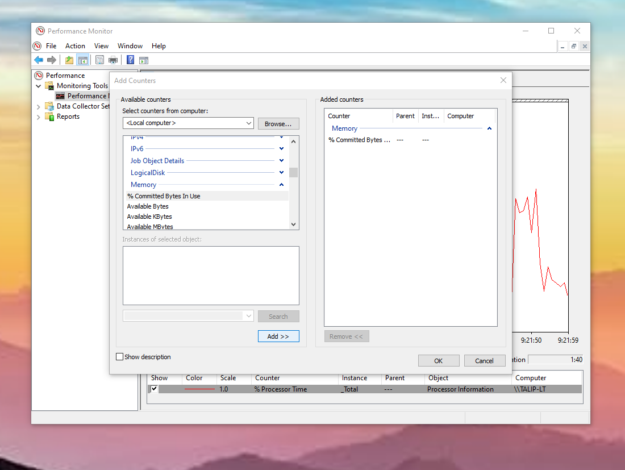
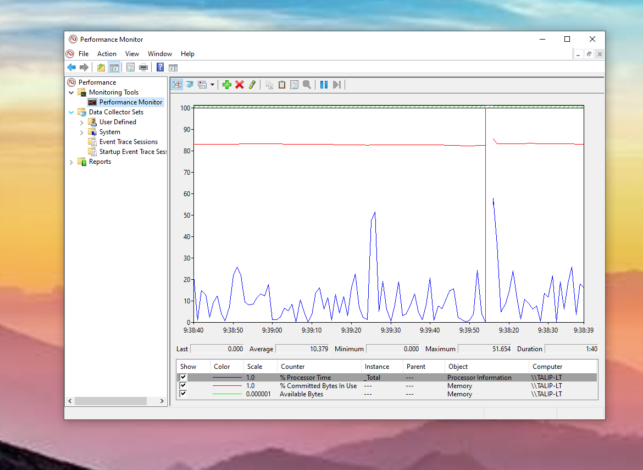
- By default, Windows Performance Monitor (WPM) monitors the % usage of the total processing power of the system. You can monitor other system factors such as the % RAM usage by clicking the green “+” in the top menu.
- In the “available counters” menu, under “Memory” we can select “% Committed Bytes in Use” and click “add” at the bottom to begin to track it as well.
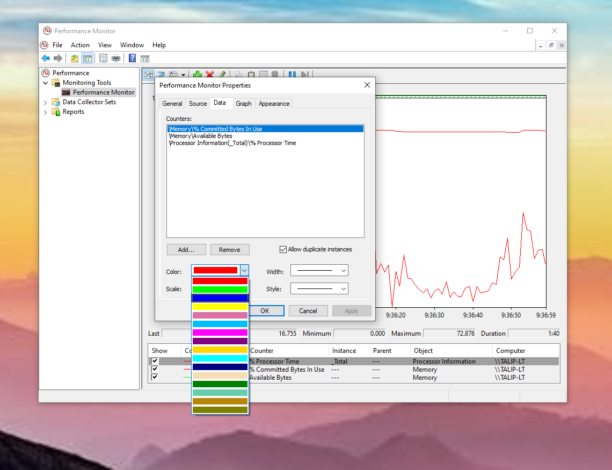
- In order to see both metrics tracked clearly, we can double click “% Committed Bytes in Use” at the bottom in order to differentiate it’s color on the graph.
How to save logs with Windows Performance Monitor
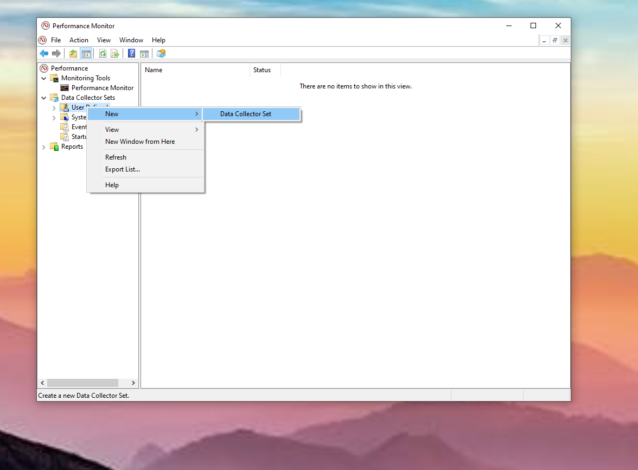
- Under the “Data Collector Sets” folder on the left panel of the Performance Monitor, right click the “User Defined” folder and select “New” and then “Data Collector Set”.
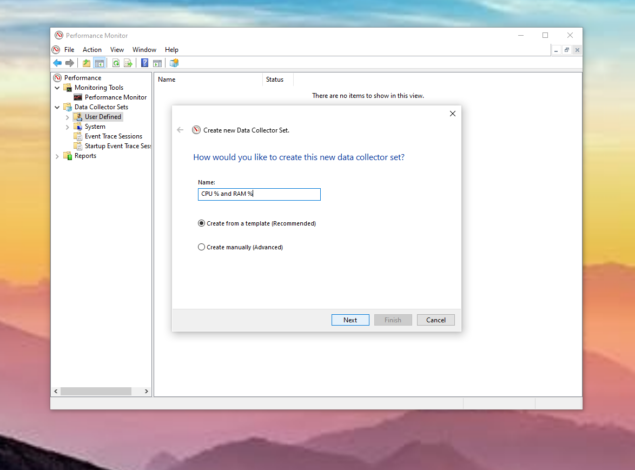
- Decide on a name and continue with the “Create from a template” radio button selected.
- Select a template. “WDAC Diagnostics” is the most detailed, but for most circumstances (especially in this case monitoring CPU and RAM usage) “System Performance” works fine.
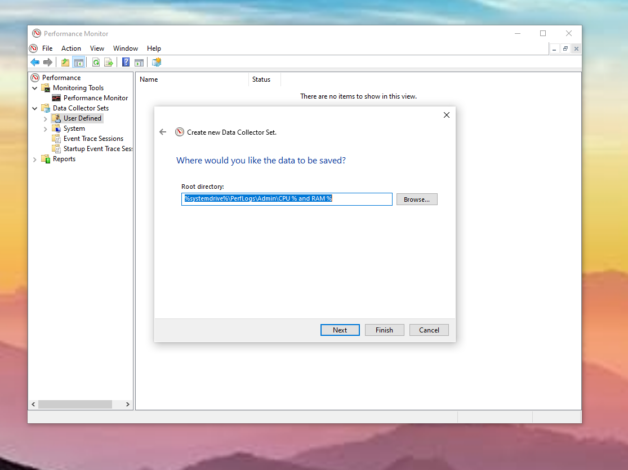
- Select a directory for the logs to be saved in.
- Finally, select the “start this data collector set now” radio button to start recording the log right away, and click “finish”.
- IMPORTANT NOTE: There is sometimes a bug with windows that attempts to ask you to log in and verify your credentials when trying to start this log, but it will not accept windows users log in credentials as the default SYSTEM profile is the required log in user and SYSTEM does not have valid user login information as we know it.
Simply erase all the text in the username and password boxes and attempt to log in with completely blank credentials, it should proceed. - You can leave the computer on to function as normal and come back later to see a full log of the CPU and RAM usage inside the directory in which you saved it, the file will open via Performance Monitor and you can browse the data.
